How I Built a URL Shortener That Handled 3,200 Redirects/Second with Go, Redis, and PostgreSQL
A URL redirect sounds simple: look up a short code, find its destination, and return an HTTP 302.
But I wanted to know what happens when thousands of requests arrive every second and the same service also needs to create links, record clicks, and serve analytics. What happens if Redis disappears? Can people still follow their links if PostgreSQL goes down? And how do you keep retries from counting the same click twice?
I built shortened.cv to explore those questions using Go, Gin, Redis, PostgreSQL, and Nuxt.
In one local, 60-second mixed-workload test, it delivered 3,200 redirects/second, alongside 100 new links/second and 10 analytics requests/second, with 7.9 ms redirect p99 latency. There were no HTTP errors or missed iterations, and all 192,000 redirect events were reconciled with PostgreSQL after the workers caught up.
On the same laptop without container limits, one hot link reached about 9,800 redirects/second for a minute, and every one of its clicks was stored.
Both are local benchmarks, not a promise of production capacity. The more interesting story is what I had to build, and what broke along the way.
Starting with the requirements
Andreyka26's Bitly system-design exercise gave me a useful reference workload: 300 million newly created URLs and 3 billion redirects per day, or roughly 3,472 creations and 34,722 redirects per second on average.
Those were design targets to explore, not numbers this implementation has achieved. I wanted to build a small working system first, test it, and find its actual limits.
At its core, shortened.cv needs to do three things:
- Create short links, including links made without signing in.
- Redirect visitors quickly and safely.
- Collect click events and turn them into useful reports.
I also added custom slugs, anonymous-link claiming, destination previews, and administrative takedowns. But the hardest decisions were behind the API.
One Go service, two different paths
Redirects need to respond immediately. Analytics can be processed a little later. I designed the system around that difference.
                        ┌── Local LRU ── Redis cache ── PostgreSQL
GET /{slug} ── Go API ─┤        (continue on cache miss)
                        └── Click buffer ── Redis Stream
                                                │
                                                ▼
                                          Batch consumers
                                                │
                                                ▼
                                           PostgreSQL
                                                │
                                                ▼
                                         Daily rollups
The Go API uses Gin for HTTP handlers, service packages for business rules, sqlc for typed database queries, and goose for migrations. The frontend is built with Nuxt.
A redirect should normally need only a cached lookup and a quick enqueue operation. It shouldn't wait for a PostgreSQL analytics insert.
Generating unique short codes
Automatically generated links use seven Base62 characters: lowercase letters, uppercase letters, and digits. That gives 62^7, or about 3.52 trillion possible codes.
I use Go's crypto/rand with rejection sampling to avoid bias when mapping random bytes to those 62 characters. The random generator proposes a slug; PostgreSQL's unique constraint guarantees uniqueness. If an insertion collides, the API tries another candidate, up to five attempts.
Soft-deleted links keep their reserved slugs. I didn't want an old shared address to be reassigned to an unrelated destination.
People can also shorten a link without creating an account. An anonymous link gets a random claim token; the database stores only its hash. If the person signs in later, they can claim the link without losing its existing click history.
Making the hot path cheap
If every redirect queried PostgreSQL, a viral link would repeat essentially the same database lookup thousands of times.
I added two cache layers:
L1: a local, size-bounded LRU cache. Each Go process keeps frequently accessed destinations in memory, with a default capacity of 100,000 links and a 60-second TTL.
L2: Redis. On a local miss, the service checks the shared Redis cache. Only a miss there requires PostgreSQL. Redis also distributes invalidation messages between API instances.
Two details matter beyond simply adding a cache:
First, concurrent misses for the same slug share one in-flight load instead of issuing duplicate database queries. A separate concurrency limit bounds database lookups for different slugs.
Second, deleting or taking down a link must invalidate cached copies. In an early failure test, a failed Redis revocation allowed an old destination to be loaded into L1 again. I added local revocation tracking and retries to address that case.
Redirects use HTTP 302 rather than 301. A browser can cache a permanent redirect and bypass the shortener on future clicks, which would undermine analytics.
Recording clicks without blocking redirects
Every successful redirect can produce an event: timestamp, source, referrer host, device, browser, UTM tags, and available location data. The API also distinguishes bot traffic from human clicks.
Writing each event synchronously would make the visitor wait for an additional database operation. Instead, events enter a memory buffer and are sent to a Redis Stream, normally in batches every 20 milliseconds or when a batch fills.
Consumers write those events to PostgreSQL in batches. Stream entries are acknowledged and removed only after the database write commits.
Retries introduce another challenge: a consumer might finish a database write and crash before acknowledging the stream entry. When another consumer replays it, the click must not be counted twice.
Each click therefore has a unique event ID. The database insert uses the event identity to skip duplicates:
ON CONFLICT (created_at, event_id) DO NOTHING
Only newly inserted, non-bot events increment the corresponding link's human-click counter. That keeps replayed batches from inflating analytics.
The trade-off is durability. The stream relies on Redis append-only persistence (appendfsync everysec) to survive a Redis restart. If Redis is unavailable or the stream exceeds its configured budget, the API falls back to an in-memory PostgreSQL writer. That fallback can lose buffered events on a crash, and its asynchronous-commit setting can trade durability for speed. The normal Redis Stream consumer uses durable database commits, but the complete pipeline is not lossless under every failure.
For privacy, click records don't retain raw IP addresses. Approximate unique-visitor counts use a keyed hash that changes each day.
Analytics has a different scaling problem
Storing clicks is only half the job. A dashboard that repeatedly scans millions of raw events can become expensive even when redirects are fast.
I partitioned raw clicks by UTC day, keep separate per-link counters, and roll closed days into aggregate tables. The default raw-event retention period is 30 days; daily summaries remain available for longer reports.
One subtle issue showed up during recovery testing: what if a delayed click belongs to a day that has already been aggregated? A database trigger marks that day as stale so maintenance can recompute the rollup.
In a separate local reporting test with three million seeded historical clicks, the API completed roughly 167 analytics requests/second alongside 1,000 redirects/second for 60 seconds. Report p95 was 16.5 ms. The reporting results and seed details record the measurements and dataset size.
What the local benchmarks actually showed
I used Grafana k6 with a disposable Docker environment on an Intel Core i7-8706G laptop with 16 GB RAM. The API had a 2-CPU / 512 MiB limit, PostgreSQL 2 CPUs / 1 GiB, and Redis 0.5 CPU / 256 MiB. k6 ran on the same host, over direct HTTP without a reverse proxy or TLS. The environment details record the commit, container limits, and settings.
The starting redirect dataset contained 1,000 links, which fit in the local cache. So these numbers are useful for warm-link performance, but they don't establish performance across millions of cold links.
| Offered workload | Duration | Redirect p99 | Outcome |
|---|---|---|---|
| 1,000 redirects/s + 50 creates/s + 10 reports/s | 120 s | 1.3 ms | Completed |
| 3,200 redirects/s + 100 creates/s + 10 reports/s | 60 s | 7.9 ms | Completed |
| 5,000 redirects/s + 100 creates/s + 10 reports/s | 30 s | 52.6 ms | Fell behind |
| 5,000 redirects/s to one hot link | 30 s | 14.2 ms | Completed |
The 3,200 r/s test completed without HTTP errors, incorrect responses, or missed iterations. After the event workers drained, PostgreSQL contained all 192,000 redirect events: 172,800 human and 19,200 bot events.
At the 5,000 r/s mixed-workload target, k6 could not start 1,023 scheduled iterations. The test delivered about 4,963 redirects/s, and redirect p99 rose to 52.6 ms. The application didn't suddenly start returning bad redirects; the workload stopped meeting the offered rate and latency target.
The difference between offered, completed, and correctly persisted requests matters. I tried to measure all three.
Link creation exposed a different limit. When offered 3,472 creations/s, the test delivered around 1,388/s, with PostgreSQL using its allocated CPU budget. Scaling the API alone wouldn't fix that bottleneck.
The load results include every stage, the failed attempts among them.
One hot link, no limits
The runs above capped every container. To see what a single cached redirect and its click cost, I later removed the caps on the same laptop: the API ran as a native Go process, PostgreSQL 17 and Redis 7.2 ran in Docker without limits, and k6 sent every request to one link over plain HTTP. Each step ramped for 20 seconds, then held its target for 60.
| Target | Delivered during hold | Errors | p95 | p99 | Clicks stored |
|---|---|---|---|---|---|
| 4,000/s | 4,000/s | 0 | 3.2 ms | 8.8 ms | 283,945 of 283,945 |
| 10,000/s | ~9,800/s | 0 | 26.8 ms | 61.3 ms | 698,171 of 698,171 |
Each redirect still recorded a click, so at the 10,000/s target the Redis stream and PostgreSQL absorbed about 9,800 click events a second. After each run, PostgreSQL held one click for every request k6 sent, warm-up included, and the stream had drained without a single failed event. An earlier attempt at the same target reached about 9,560/s with p95 39.3 ms; every click was stored there too.
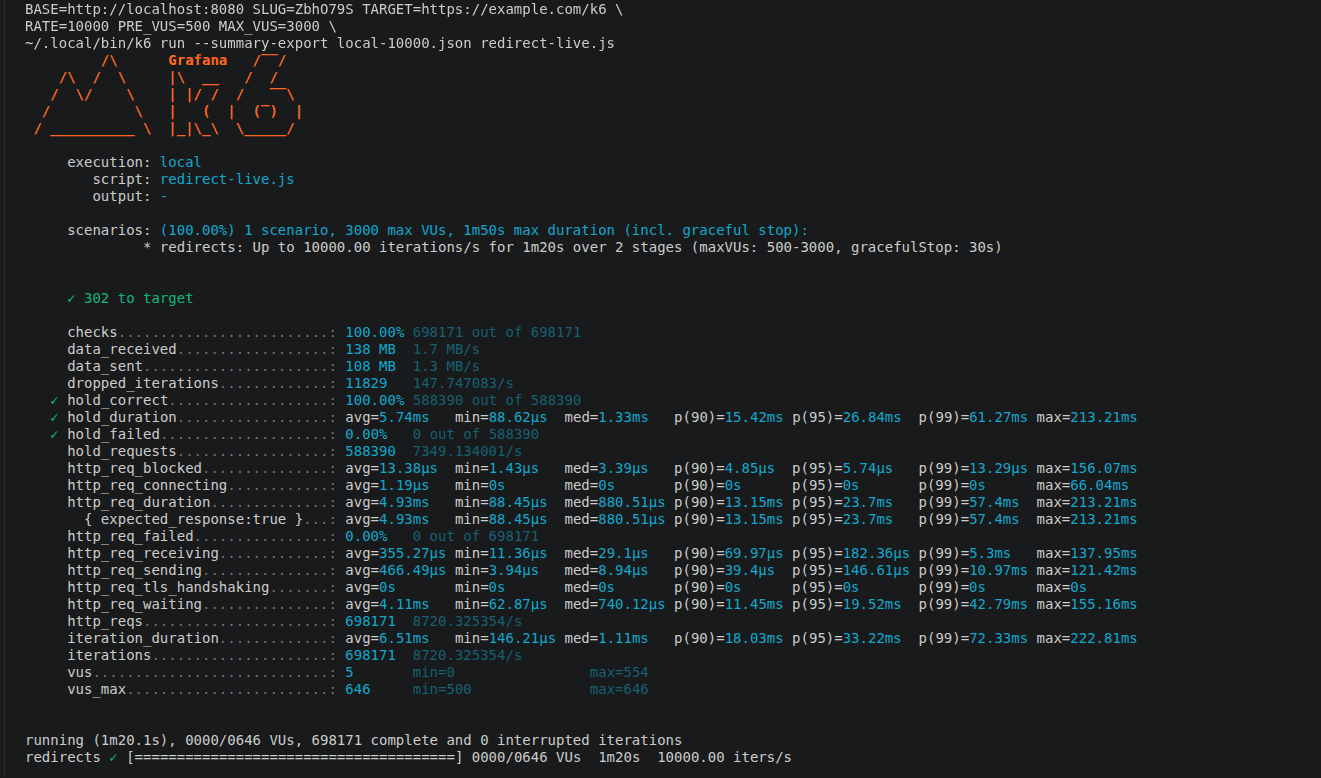
The 10,000/s target wasn't fully met: k6 couldn't schedule 11,829 iterations, almost all of them during the held minute. While the 4,000/s step ran, I sampled each process's CPU once a second:
| Process | Cores at 4,000/s | Per 1,000/s |
|---|---|---|
| Go API, including the click workers | 0.70 | 0.18 |
| PostgreSQL | 0.34 | 0.09 |
| Redis | 0.02 | under 0.01 |
| k6 | 1.53 | 0.38 |
Scaled in a straight line, 10,000/s would need about 2.7 cores for the API, PostgreSQL, and Redis, plus 3.8 for k6. That's more than a four-core laptop can spare while it also runs my editor and browser, which fits what happened: k6 fell behind, and the API never returned an error. It also suggests a dedicated four-core machine could serve 10,000 cached redirects a second with the load generator elsewhere. That's an estimate, not a measurement.
These runs show the cost of a cached redirect and its click, and nothing more. They don't cover cold links, new TLS connections, or production traffic, and they aren't comparable to the capped runs above. The 4,000/s and 10,000/s summaries, the per-process and host CPU samples, and the environment are published with the rest of the evidence.
The failure tests taught me more than the throughput tests
I deliberately interrupted parts of the stack to find out what survived:
- PostgreSQL unavailable: Warm links kept redirecting at 500 r/s during a roughly six-second outage. Uncached links returned
503until the database came back; the completed test's click events were reconciled afterward. - Redis unavailable: The two-instance rehearsal saw redirect tail latency rise from around 2 ms to 51 ms. I added backoff so requests wouldn't each wait on an already failing Redis call.
- API crash: One recovery test reclaimed all 100 sampled queued clicks after about 61 seconds. But a separate two-instance failure rehearsal lost four clicks from the killed API's memory buffer and recorded 58 incorrect responses across its broader fault stage.
- Cache invalidation: A failed revocation exposed the risk of serving a deleted link from stale cache state. Local revocation tracking and retry tests came out of that investigation.
These weren't all the same experiment, and I don't interpret one successful recovery sample as a guarantee. They gave me concrete bugs to fix and failure modes to document. The single-instance fault checks and the two-instance rehearsal record each set of conditions and outcomes.
Then I tested the live VPS
The live service runs through Traefik and HTTPS on a four-vCPU Contabo VPS, managed with Coolify and shared with two other applications.
This test was intentionally different from the laptop benchmark: k6 exercised one warm short link through the real public endpoint, ramping to each rate for 20 seconds before holding it for a minute. But k6 still ran on the same VPS, competing with Traefik, the API, Redis, and PostgreSQL for CPU.
| Offered redirect rate | Approx. delivered during hold | Reported p95 | Reported p99 | Completed HTTP errors |
|---|---|---|---|---|
| 1,000/s | ~1,000/s | 13.8 ms | 39.6 ms | 0 |
| 2,000/s | ~1,978/s | 68.1 ms | 152 ms | 0 |
| 3,000/s | Not sustained; run aborted during ramp | — | — | — |
The 2,000 r/s attempt had 462 unsent iterations across the full ramp-and-hold run, even though the completed requests returned the expected redirect. At 3,000 r/s, the shared host became CPU-saturated and latencies grew to seconds before the test stopped.
At the 2,000 target, the Go API used roughly 0.5 vCPU and 115 MB of memory, while Traefik and k6 took about a vCPU each. That's encouraging for the redirect handler, but it doesn't establish the API's standalone limit or a production capacity guarantee. These requests reused TLS connections and all targeted one warm link.
The held-window figures are also approximate. The script used for this run started its warm-up clock separately for each k6 virtual user, so users added mid-run had their first 20 seconds left out of the measured minute. The script now times the warm-up from the scenario start.
So I can say the deployed system served a substantial amount of traffic through HTTPS with correct responses. I can't yet say what it will sustain under realistic visitors and a separate load generator. The production environment and held-minute results are published alongside the CPU samples and scripts in the benchmarks folder.
What I'm taking away
This project started as a URL shortener and turned into a practical lesson in how distributed systems behave under pressure.
The local cache made hot redirects inexpensive. Redis Streams separated click ingestion from the HTTP path and, locally, kept up with about 9,800 clicks a second without losing one. Event IDs made retries safe from duplicate counting. Daily rollups kept reporting work bounded. And failure testing uncovered bugs that a healthy-system benchmark never would have found.
Next, I want to re-run the live test with the corrected script from a separate machine, test a larger mix of cold and hot links, and rehearse restoring PostgreSQL from backup.
The source code, benchmark scripts, successful runs, and failed attempts are public:
- Project: shortened.cv
- Source code: IbrahimIjai/sh.sh
- Benchmark evidence: benchmarks/
If you're working on similar caching, analytics, or reliability problems, I'd be interested in your feedback.